Mobile app user acquisition is the work of getting new people to install and use your app, through paid ads, organic discovery or both. The cheapest installs usually come from the app store itself: a listing that ranks for the right keywords and converts visitors costs nothing per click, and it makes every paid dollar work harder. The catch is that you can only improve what you measure, so we built ASO Gauge to check your rankings by country three times a day and show whether a listing change moved them.
TL;DR
- User acquisition (UA) has three jobs: get discovered, win the install, and keep the user long enough to pay back what you spent.
- Organic discovery through the app store and paid channels work as a pair. Better rankings and a better listing lower the effective cost of every paid install.
- Judge channels by cost per retained user and lifetime value against acquisition cost, not by cost per install alone.
- The most dependable way to reduce acquisition costs is to raise store conversion, improve retention and diversify channels by payback time.
- ASO Gauge tracks rankings in up to 175 countries three times a day, so you can see whether each listing change worked. It is a one-time $39 license after a 7-day free trial.
What mobile app user acquisition covers
User acquisition is the process of attracting new users to an app through marketing. Some definitions limit it to paid installs. In practice, teams count both paid campaigns and organic sources such as app store search, referrals, content and social media.
The goal is not installs for their own sake. It is to gain users who generate more revenue than they cost to acquire. That is why acquisition and retention belong in the same plan: one widely cited industry figure says 96% of users stop using an app within 30 days of installing it. If most of the people you pay for disappear, the economics break, however cheap the install was.
The competition is also heavy. RPLG notes that more than 7 million apps sit across the iOS and Google Play stores, so relying on organic traffic alone rarely works for a new app.
The funnel: from discovery to retained user
Think of acquisition as a loop with three connected stages, as Unity describes it:
- Awareness. People see your brand or app through ads, social posts, press, word of mouth or a search result in the store.
- Acquisition. They land on your store listing and decide whether to install.
- Retention. They use the app, which turns the install into revenue and referrals that fund the next round.
Discovery is not mostly paid. A 2015 Google study, cited in Adapty’s funnel guide, found people discovered new apps through friends, family and colleagues (52%), inside the app store (40%) and through search engines (27%). The study is old, but it shows a pattern that still holds: the store listing is where nearly every route ends, paid or not.
That makes the listing the most important page in your funnel. Everyone you pay to reach, and everyone who finds you through search, sees the same title, icon, screenshots and description before deciding.
Paid and organic channels
Paid channels
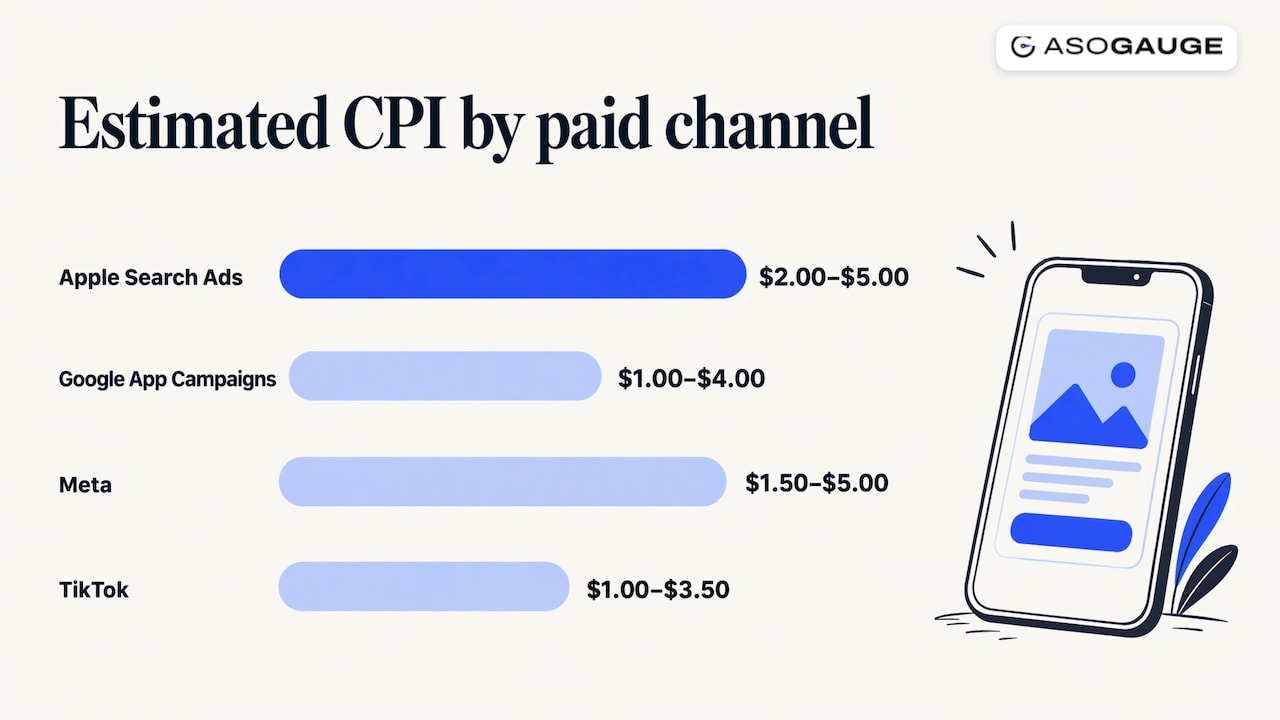
The main paid routes are social platforms such as Meta and TikTok, Google’s app campaigns, Apple Search Ads and ad networks. Published cost-per-install ranges vary by source and period. One March 2026 CAC guide lists Apple Search Ads at $2.00 to $5.00 per install, Google App Campaigns at $1.00 to $4.00, Meta at $1.50 to $5.00 and TikTok at $1.00 to $3.50. Treat these as orientation, not a promise: your own category, country and creative decide your number.
Country matters most. AppSamurai’s 2025 benchmarks say Tier 1 markets such as the US, UK and Japan are often three to five times more expensive than emerging markets. If you buy installs in several countries, you need to know where you already rank in each one before you spend. Our guide to Apple Search Ads costs, keywords and campaigns covers the Apple channel in more depth.
Organic channels
Organic acquisition means app store search and browse, referrals, content, email and social. MobiLoud reports that as of 2022 roughly 60% of installs were organic, and that organic users made up 58% of installs but 72% of app sessions. In its numbers, paid users also retained worse than organic ones.
The two sides feed each other. The more people install and use an app, the higher it tends to rank in store search, which brings more organic installs. A paid push can therefore lift your rankings, and better rankings can lower your blended cost.
Why the store listing sets your acquisition cost
Here is the arithmetic that most acquisition plans skip. Say you pay for 10,000 visits to your listing. If 25% install, you get 2,500 installs. If a better listing converts 35%, you get 3,500 from the same spend. ApsteQ’s July 2026 cost guide puts that gap at about 40% more installs from the same paid traffic. The CAC guide cited above frames the same move as an effective 28% cut in cost per install.
So store optimization is not a side project to run after the campaigns. It is the multiplier on the campaigns. Research agrees on direction: an academic study of game app downloads found that app store optimization factors and social media promotion together explained 18.4% of the variance in downloads, with screenshots and app size the highest-ranked optimization factors. That is a meaningful share, though not the whole story, and it comes from one study of game apps in India.
For organic traffic, the listing also decides whether you appear at all. Our guides to how App Store search ranks apps and Google Play search ranking explain what each store documents and what has been measured. If you want the full picture of what to track, start with our overview of app store optimization.
How to build an acquisition plan, step by step
1. Set the economics before you spend
Work out what a user is worth. Lifetime value (LTV) is the revenue an average user brings over their life with your app. Customer acquisition cost (CAC) is what you spend to get one. AppSamurai states that sustainable mobile businesses keep LTV at least three times CAC. If you cannot yet estimate LTV, use early cohort data: revenue per install at day 7, day 30 and day 90.
2. Fix the listing first
Before paying for traffic, make sure the page converts. That means keywords in your title and subtitle that match how people search, screenshots that show the main benefit in the first frames, and localized text for every market you target. Apple lets you test alternative pages; our walkthrough of product page optimization A/B tests shows how the tests work.
This is the step where ASO Gauge does its job. It checks your rankings in each country three times a day, so you see where your app appears for each keyword. It then monitors the effect of your listing changes on those rankings. Its AI produces 20 listing improvement proposals a month and checks them against app store rules, so a suggested change does not put the listing at risk of rejection. You can read more about finding and tracking ASO keywords on both stores.
3. Pick two or three channels, not ten
Start with the channels closest to purchase intent. Search-based channels, such as store search and Apple Search Ads, reach people already looking for an app like yours. Admiral Media’s 2026 guide notes Apple Search Ads tends to deliver better trial-to-paid conversion for subscription apps than social channels. Add a social or video channel once you have creative that works, and judge it by payback time: paid social often needs 120 to 180 days to evaluate quality, according to ApsteQ.
4. Set up measurement early
Privacy rules now limit how precisely you can follow a user from ad to install, particularly on iOS under Apple’s App Tracking Transparency framework. Use a mobile measurement partner for attribution from day one, and compare its numbers with your own billing records before concluding that performance changed. Attribution tells you where installs came from. It does not on its own prove that an ad caused them.
5. Review weekly, decide monthly
Check cost, installs and rankings weekly. Decide on budget shifts monthly, using cohort data rather than a single week of installs. A change in rank after you edit a listing is the signal you want; a flat line after two or three weeks tells you the change did not help.
Metrics that decide where the budget goes
Cost per install (CPI) is easy to find and easy to misread. It compares channels at a glance, but a cheap install that churns costs more than a pricey one that stays. These are the numbers to track alongside it:
| Metric | What it tells you | How to use it |
|---|---|---|
| Cost per install (CPI) | Price of one download | Compare channels and countries, never decide on it alone |
| Cost per retained user | Spend divided by users still active at day 30 | Find the channel that really pays |
| Retention (day 1, 7, 30) | Whether users find value | Spot onboarding or targeting problems |
| LTV to CAC ratio | Whether growth is profitable | Aim for at least 3:1 |
| Store conversion rate | Share of listing visitors who install | Your most direct lever on blended CPI |
| Keyword rank by country | Where you appear in search | Show whether listing changes work |
Benchmarks help you see if you are in range, with caveats. AppSamurai’s guide reports average retention of 35% to 45% on day 1, 20% to 30% on day 7 and 10% to 15% on day 30, while Phiture’s data puts the averages lower. Sources disagree because they measure different app sets. Use your own cohorts as the real baseline and the published ranges as a sanity check.
How to reduce app acquisition costs
There is no single trick. Costs fall when several small gains stack up:
- Raise store conversion. Moving from 25% to 35% is worth roughly as much as cutting your CPI by more than a quarter, as shown above.
- Test more creative. ApsteQ reports that teams running 8 to 12 creative variants per campaign and iterating on them see 20% to 35% lower CPI within 60 days. That is the company’s own guidance, not a guarantee.
- Target by predicted value. The Mode Earn app case reported by AdExchanger shows what is possible: AI targeting at users likely to stay active cut acquisition cost 29%, from $2.69 to $1.90. Results from one app will not transfer exactly to yours.
- Pay more for the right segment. Paying twice the CPI for users with three times the lifetime value is still the better deal.
- Grow organic share. Every install from search or referral carries no media cost. If 20% of new users arrive through referrals, your blended CAC drops by about 20%, according to the CAC guide linked earlier.
- Win in the right countries. Because costs vary so much by market, look for countries where your app already ranks or could rank with little effort, and put organic effort there before paying Tier 1 prices.
The common thread is that you need feedback you can trust. Without ranking data per country and per keyword, you cannot tell whether a screenshot change helped or whether a competitor simply dropped.
Seeing the effect of every change with ASO Gauge
ASO Gauge is a desktop tool for macOS, Windows and Linux. It tracks your app’s rankings on the App Store and Google Play in up to 175 countries, three times a day, and analyzes keyword performance. It also compares your rankings with competitors’ and monitors the impact of each listing change on your position. The 20 monthly AI proposals give you a steady list of tested ideas for titles, subtitles and descriptions.
The license is a one-time $39 payment, with no subscription, after a 7-day free trial. You can see the details on the Lifetime Licence page.
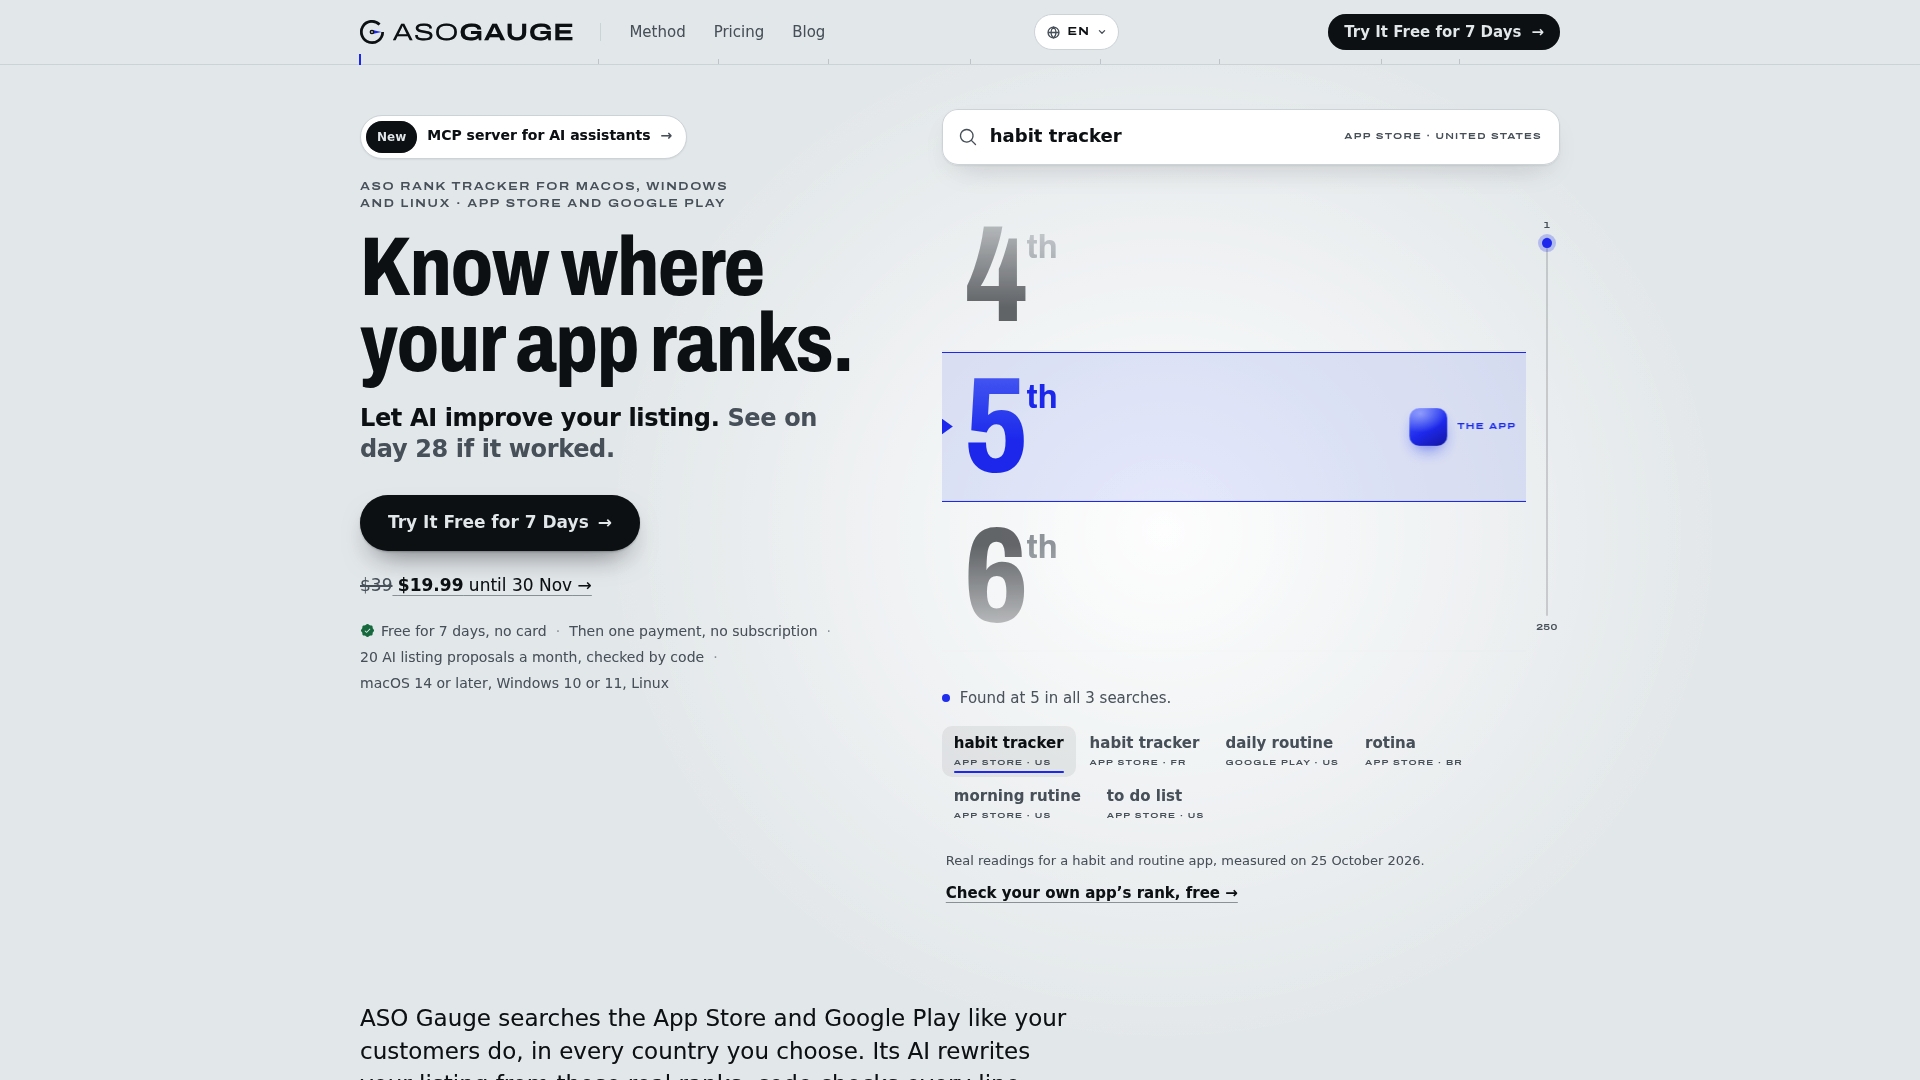
If you want to see where you rank before committing, the app rank checker is the quickest place to begin. Teams that work through an AI assistant can also read about the MCP server, which brings store ranks into that workflow. If you are weighing tools more broadly, our comparison of the best ASO tools lays out the options by type.
Where acquisition is heading
Growth is a loop rather than a one-way funnel. Users who stay leave reviews, recommend the app and lift your rankings, which lowers the cost of the next user. Teams that treat store optimization, paid campaigns and retention as one system tend to measure success by the quality of users, not install volume. That is also why measurement matters more every year: tighter privacy rules mean less precise attribution, which makes first-party signals such as your own rankings and store conversion more valuable.
If you are still building the app, our guide on how to make an app covers the road to the stores, and the ASO blog goes deeper on search in both stores.
FAQ
What is mobile app user acquisition?
It is the set of marketing activities that bring new users to your app, both paid, such as ads, and organic, such as store search and referrals. The aim is to gain users who earn more than they cost. It is usually tracked from first impression through install to retention.
How much does it cost to acquire a mobile app user?
It depends on channel, category and country. Published averages for the global cost per install in 2025 range from about $1.50 to $5.00, and Phiture reports North America as the most expensive region at $5.28 on average. Your own figures from cohorts matter more than any average.
What is the fastest way to reduce acquisition costs?
Improve your store listing conversion first, because it lowers the cost of every channel at once. Then test more creative and shift budget to channels with the best cost per retained user. Track rankings per country so you can see which changes worked.
Is organic or paid acquisition better?
Use both. Paid campaigns give speed and control, while organic search and referrals give lower cost and, in the data cited above, better retention. A well-optimized listing makes the paid side cheaper.
Sources
- What is user acquisition and how is it evolving
- User Acquisition for Apps: Strategies, Metrics, and Success
- User Acquisition for Mobile Games: The Complete Guide
- Step-by-step app funnel analysis guide
- Customer Acquisition Cost (CAC): Calculation and benchmarks
- Mobile User Acquisition: The Definitive Guide for 2025
- The Best Channels for Mobile App User Acquisition
- App User Acquisition Cost: CPI by Channel
- Unlocking App Appeal: A Consumer-Centric Exploration of App Downloads
- Mobile App User Acquisition Strategy: The Complete Guide
- This App Is Using AI To Reach People With A High Likelihood To Stay Loyal
- Refining Your Paid User Acquisition Strategy